How to debug your Linux Application: Debugging by printf
In this part of the series on How to Survive Embedded Linux series focuses specifically on debugging C/C++ applications. Apps written in scripting languages like Perl or Python have their own debugging best-practices protocols and tools.
This is the simplest technique, directly analogous to ‘Debugging by printk’ in the previous article “How to Debug your Linux BSP”. This method is the most commonly used by engineers who prefer not to use a debugger. The usual caveats apply, adding print statements can wildly affect timing, which can causes old bugs to vanish and new ones to appear.
Always remember to clean up your debug prints before shipping your code! An old piece of advice is, “never remove your debug prints”; if they were useful to add in once then they may be useful again. While this piece of advice becomes onerous if carried out all the time, it does lead us on to our next topic…
Debugging by logging
A log message is a bit like a debug print line that you leave inside the project. You add these in as you go.
Often, a large project will contain its own logging system. This will allow different levels of log messages to be used throughout the code, with some level of configurability determining what is done with those messages.
This doesn’t have to be very complicated to implement; generally, you’d create a function that looks something like the following:
int log_printf(enum log_level lvl, const char *fmt, …);
Inside this function, there would typically be some logic to send the log message to different places given the debug level passed. I will highlight a few examples of different debug levels below:
LOG_ERROR
At the top of the logging food chain, would be the error message. Any time a major error occurs, this should be printed to the user on STDERR with a decent amount of information.
LOG_WARNING
A warning is just that, it might be an issue or it might not. Typically, this should be printed to the user on STDERR. Some information is good, but don’t overload the user too much.
LOG_DEBUG
This is the sort of message that can help the developer understand what’s going on. But by default, it probably shouldn’t even be getting compiled into the released source code. If it is compiled in, it should be getting sent to a file and not overloading the user with too much information.
These are not hard and fast rules, it very much depends on what your application is doing, how large it is, how it interacts with other systems and so-on. The general point though, is that logging and especially good error messages can save time. It will take slightly longer to write the code in the first place, but it is a good habit to get into, and when problems do show up it can help you to diagnose the problem immediately without any further debug effort required.
Debugging by GDB
The GNU project provides a command line debugging tool called GDB. This can be very helpful during development as, just like a regular debugger, it can help you see what’s going on inside the program. It can even be useful to find out where a segmentation fault occurred.
To begin using GDB, the application you are compiling with must have debug flags enabled. These are like little bookmarks throughout your compiled code, which link machine instructions back to the file and line it originally came from in your C sources. Simply add “-g” into your CFLAGS.
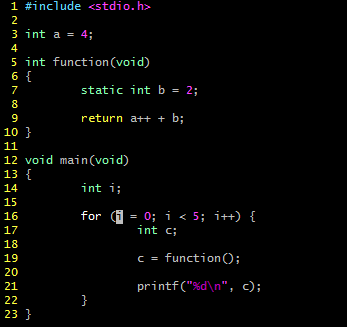
To run a program with gdb, simply run ‘gdb ’. As an example, here is a simple C file called “a.c”.
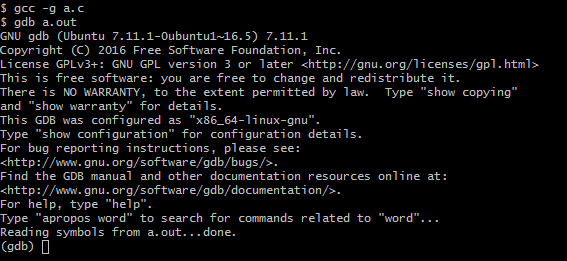
I compile with “-g” and run it with gdb and get to a (gdb) prompt.
From here I can run the program, set breakpoints, example values and do single steps.
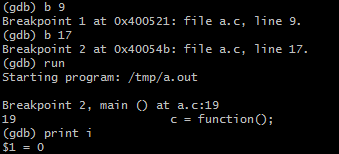
In the above screenshot, I set breakpoints at lines 9, 17, and run the program. It first stops at line 19 (line 17 is only the declaration of a variable so execution will not stop here). From here, I examine the value of the variable ‘i’ which is shown to be zero.
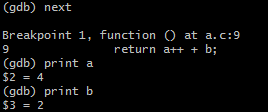
From here I go to the next breakpoint, which is inside my function call, I examine the values contained in ‘a’ and ‘b’, and we can see they contain four and two respectively.
This is just a small sample of how to use GDB. It is very powerful and there are many more things you can do with it. However, it is a little cumbersome to debug like this on the command line. GDB can either be used interactively — as we’ve seen — or it can be used as simply a backend for a much more user-friendly interface.
Debugging by VisualGDB
VisualGDB is a commercial software add-on to Microsoft Visual Studio. It’s a godsend for programmers who wish to develop in the Visual Studio environment they are used to, but also need the flexibility to target any sort of Linux platform.
Generally, to use VisualGDB you’ll want three separate machines.
- The Visual Studio host machine — this is where you’ll develop and debug your application.
- The cross-compilation machine — this is where VisualGDB will farm out compilation of your application. Your target’s corresponding Yocto SDK should be installed here.
- The target machine — this is where your app will be running and where GDB will be running as a backend.
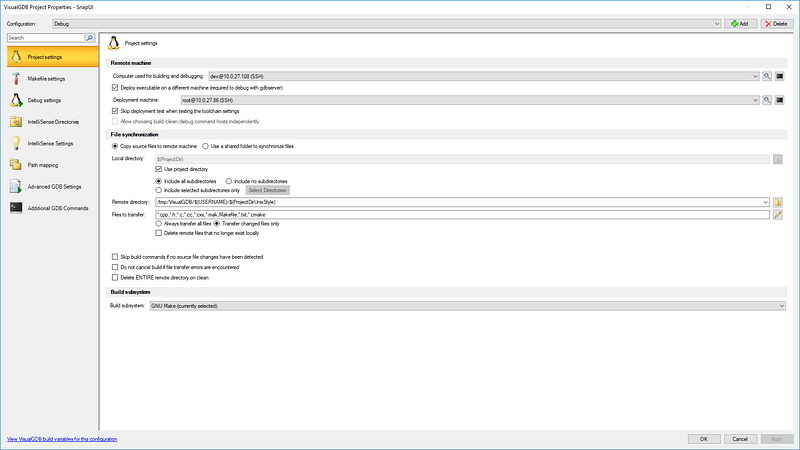
Once you have all this setup, you will be able to set breakpoints in various files with the mouse, and debug just like (or similar to) a native Windows application. For a lot of developers, this makes life much easier.
Debugging with Valgrind
One last tool I’d like to mention in this article is Valgrind. It’s actually a suite of tools, but the most important one is Memcheck.
This tool is useful for discovering memory leaks or out-of-bounds accesses, common issues in C/C++. To run it, first make sure your program was compiled with “-g” as described in the ‘Debugging with GDB’ section, then simply run your program with the following:
valgrind — leak-check=yes
Your program will run many times slower than normal; this is due to it running your program in a virtual environment, where in-depth real-time memory analysis can take place as it is being run.
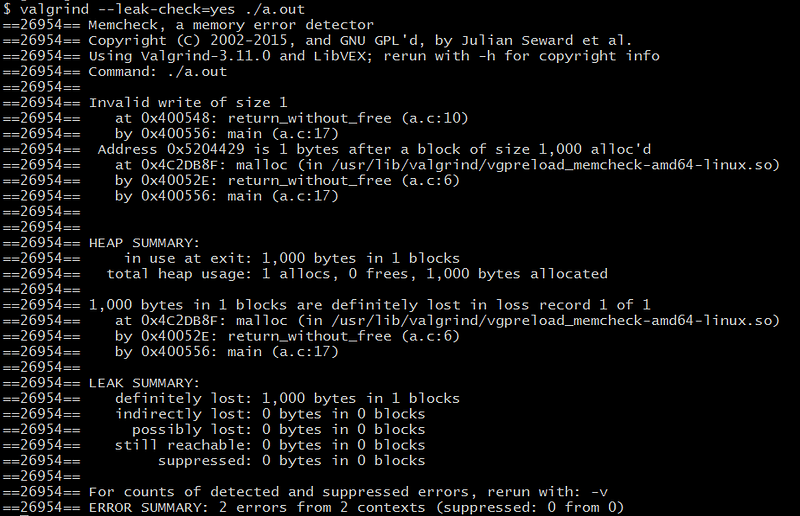
Depending on the complexity and structure of your program, Valgrind may or may not be able to provide you with any useful information. Not all boundary errors can be caught, however if you do find your application is leaking memory or seg-faulting, Valgrind can be a great zero-effort first attempt in tracking it down.
Debugging your Linux kernel requires a different approach to debugging your Linux application. We’ll take a closer look at that in the next part of How to Survive Embedded Linux.
Also published on Medium
How can ByteSnap help you today?
From start-ups to blue chips, ByteSnap’s embedded systems developers are enabling companies to stay a step ahead by providing them with bespoke solutions. Maintain your competitive edge – contact us today and find out how we can optimise your product development!